|
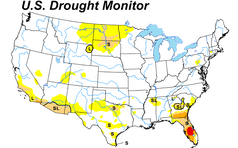
The US Drought Portal has a comprehensive collection of data, maps, and tools to monitor current and future drought. Watch this Video for an introduction to NIDIS.
The maps and data tab offers different US Drought Monitor map options by time and places.
|
This Weather and Crop Bulletin from the USDA has weekly maps and crop updates.
The USDA Ag in Drought shows current drought impacts by production type across the U.S.
|
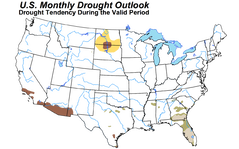
The National Weather Service (NWS) hosts Monthly and Seasonal Drought Outlook graphics.
The weekly Water Update from the NRCS includes other water supply indicators.
|
|
What about Soil Moisture?
|
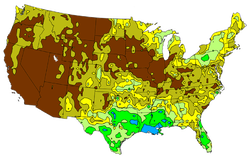
The NWS Climate Prediction Center provides soil moisture graphics including anomalies, monthly totals, and seasonal changes.
|
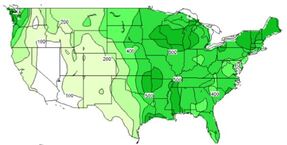
The Additional Precipitation Needed map approximates the precipitation needed to return to restore soil moisture to normal.
|
|
Check the Current & Forecast Weather
|
Read State Reports
|


