
|
During drougthy spells, many of you may have wondered, "where is all the water going?" Everyone remembers the water cycle image from grade school. A new interactive diagram from the USGS illustrating precipitation and evaporation over land and oceans, atmospheric water vapor and its movement, river runoff, and water storage including groundwater, soil moisture and snowpack. There are lots of pieces to the puzzle as water changes from liquid, solid, and gas. 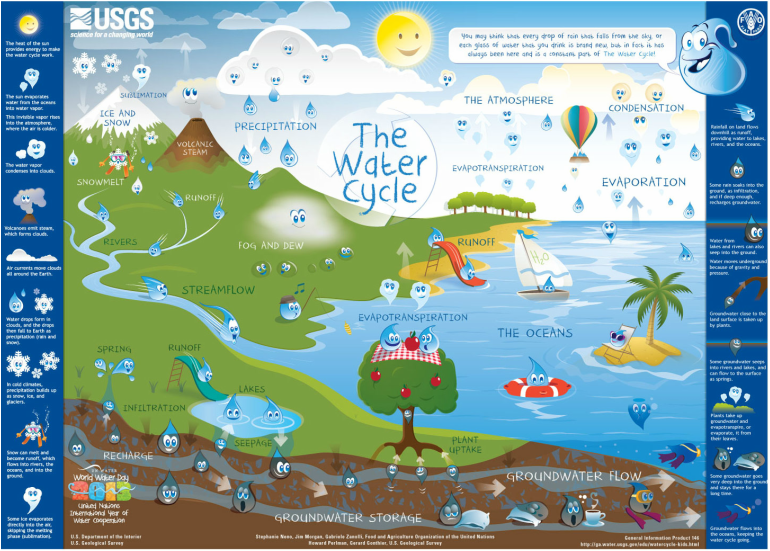 But to fully understand what that means for you and your community, scientists will need to incorporate ground-based observations. In this way, the Spotty Rain Project can help create better models for predicting drought. As atmospheric scientist Tristan L'Ecuyer explains, "Precipitation changes are more difficult to predict than temperature changes because rain and snow involve processes in clouds that take place on the order of miles—scales too small to resolve for most climate models, whose smallest unit is often about the size of Connecticut. Having better estimates of current precipitation rates and how they vary with the seasons is critical to improve the models." article by Ellen Gray, NASA Of course, satellite measurements aren't perfect. But one NASA study has come close to understanding where are water goes on a global scale (see more). 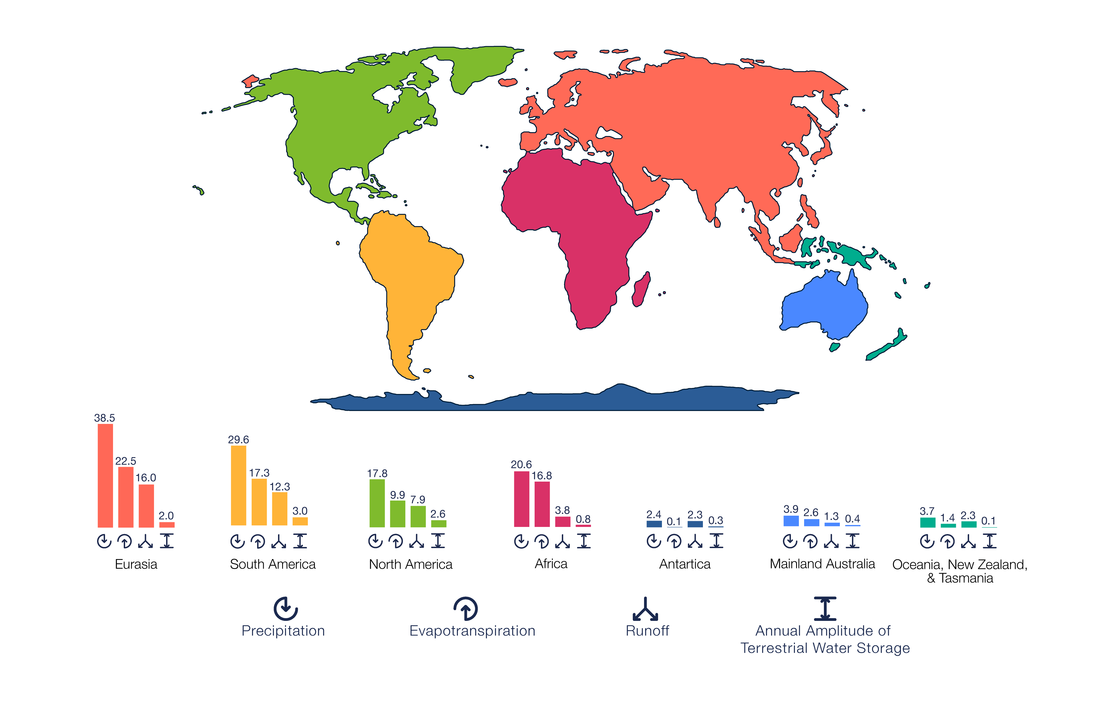 |
 RSS Feed