
|
USGS Groundwater Watch
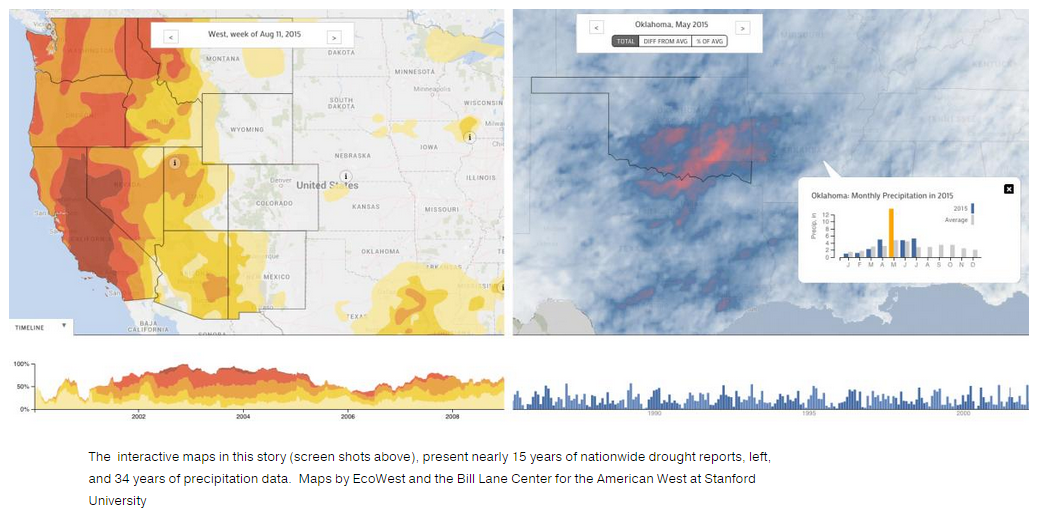
https://groundwaterwatch.usgs.gov/ USGS Water (Streamflow) Watch https://waterwatch.usgs.gov/index.php USGS Real Time Water Data https://waterdata.usgs.gov/nwis FAQS About El Nino/La Nina http://www.cpc.ncep.noaa.gov/products/analysis_monitoring/ensostuff/prelude_to_ensofaq.shtml NWS ENSO Update http://www.weather.gov/peac/update El Nino Effect on Crops https://www.youtube.com/watch?v=WgEZNM3MMVA Every week analysts for the USDA, NOAA, and University of Nebraska-Lincoln compile measures such as temperature, rain, soil moisture, and vegetation health into an easy-to-follow digest. What is the US Drought monitor? brochure How is drought assessed? CoCoRaHS video During drougthy spells, many of you may have wondered, "where is all the water going?" Everyone remembers the water cycle image from grade school. A new interactive diagram from the USGS illustrating precipitation and evaporation over land and oceans, atmospheric water vapor and its movement, river runoff, and water storage including groundwater, soil moisture and snowpack. There are lots of pieces to the puzzle as water changes from liquid, solid, and gas. 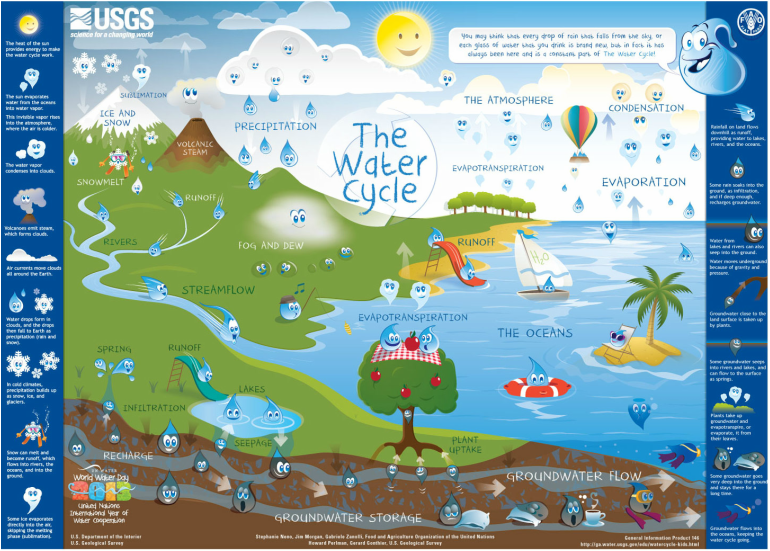 But to fully understand what that means for you and your community, scientists will need to incorporate ground-based observations. In this way, the Spotty Rain Project can help create better models for predicting drought. As atmospheric scientist Tristan L'Ecuyer explains, "Precipitation changes are more difficult to predict than temperature changes because rain and snow involve processes in clouds that take place on the order of miles—scales too small to resolve for most climate models, whose smallest unit is often about the size of Connecticut. Having better estimates of current precipitation rates and how they vary with the seasons is critical to improve the models." article by Ellen Gray, NASA Of course, satellite measurements aren't perfect. But one NASA study has come close to understanding where are water goes on a global scale (see more). 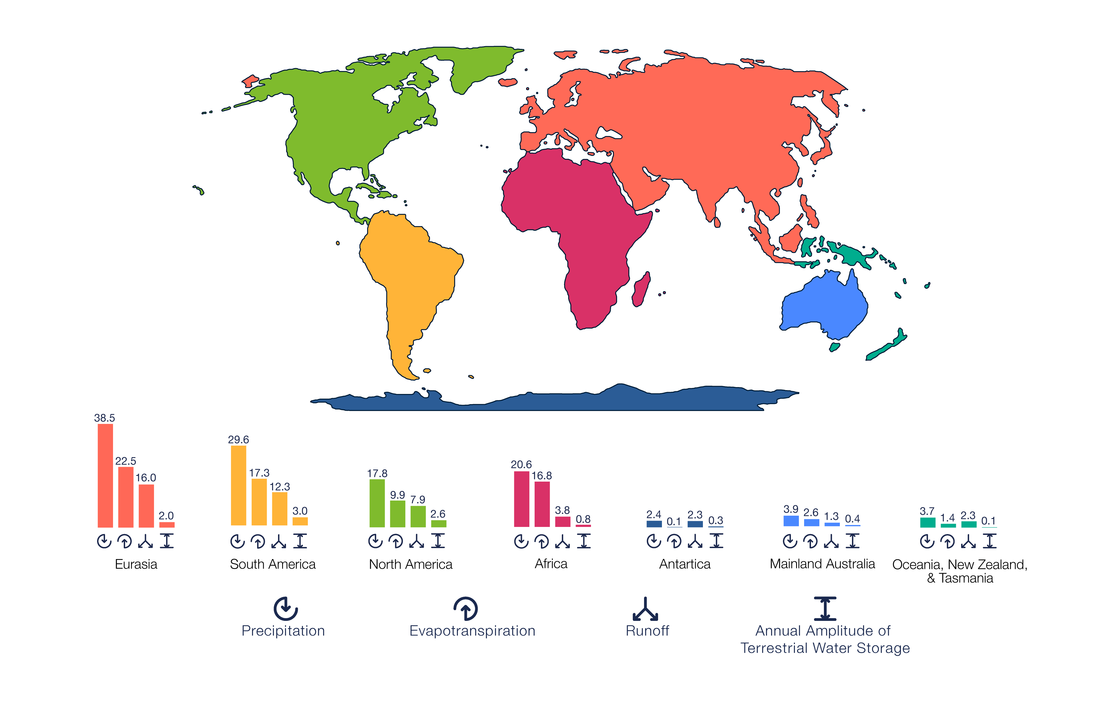
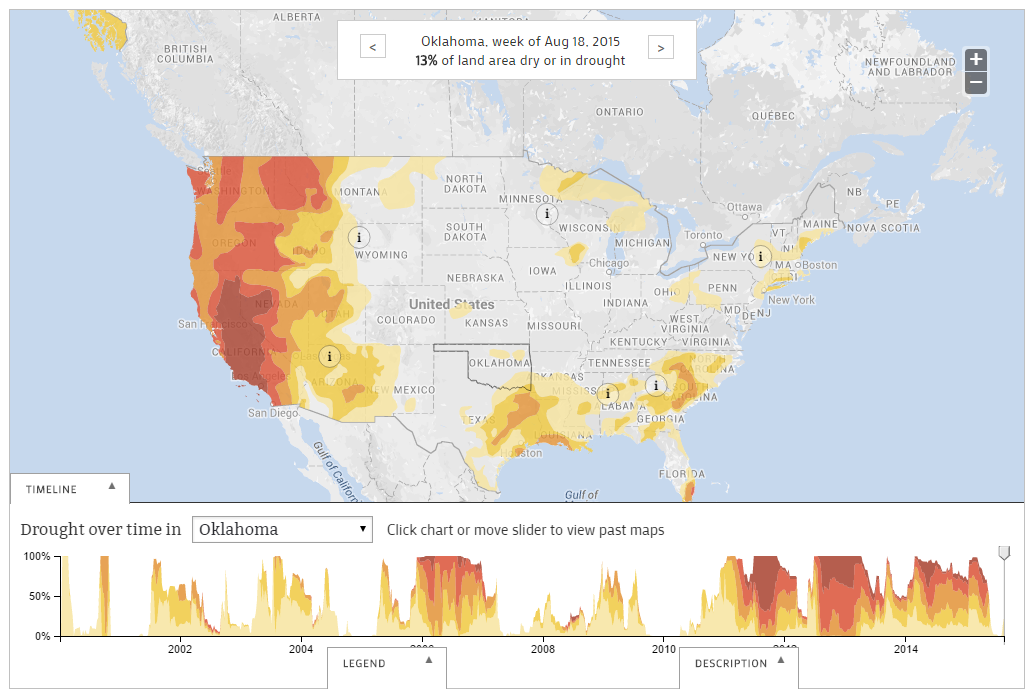
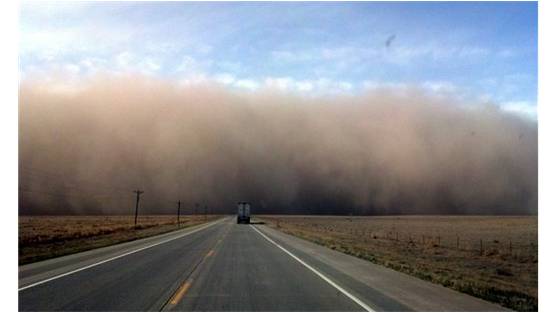
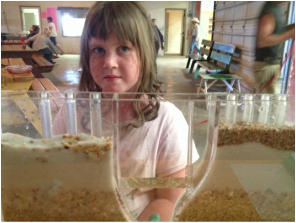
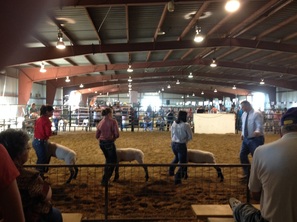
By all accounts, things are droughty out here. And have been like that for too long! But how does it compare to the Dust Bowl of the 1930's? Or the dry periods in the 1950's and 1970's? A lot of old timers say it is just as bad. At least it rained during the Dust Bowl! The land is blowing again. The thistle/tumbleweed are thick. The only consolation is the ability to learn from the Dust Bowl and to improve our farming practices. There are dry periods and wet periods. This Oklahoma Climatological Survey chart below shows the annual precipitation history with 5-year tendencies. The wet periods are green and the dry periods are brown. If you look closely, you can see the 1950's was more severe than the 1930's. While the wet and dry periods seem to alternate every ten years, there was a long lasting wet period that began in the 1980's. Although hardly a consolation, in climatological terms it seems we were overdue for a drought! 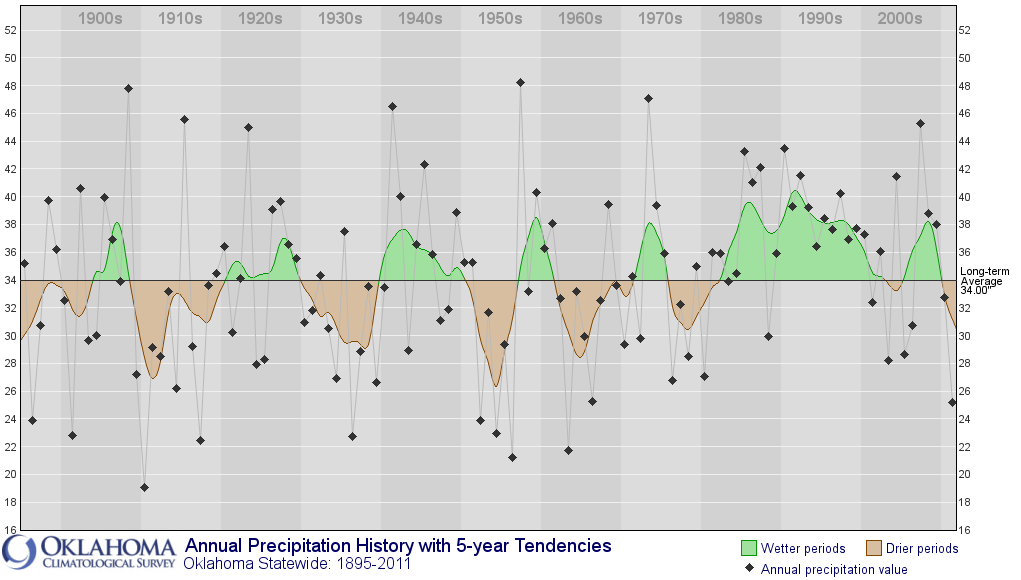 Scientists were surprised by the 2012 Central Plains Drought. According to a NOAA Drought Task Force, the period of May through August 2012 was the "driest period since 1895, eclipsing the driest summer of 1934 and 1936". Apparently, this onset of this "flash" drought was hard to predict and for many farmers (expecting relief from early years) found the US Seasonal Drought Outlook warning was just too late. The impact was devastating as the Central Plains experienced the largest single year loss in corn since 1866. This animation shows the USDM from November 2011 to December 2012. How does this drought compare? Use the Drought Risk Atlas to get historical drought information and use an interactive visualization tool for assessing your risk to drought. For us, Spotty Rain is a place to wonder about the relationship between people (land and livelihood) and water (rain and groundwater) in times of agricultural drought. The idea for Spotty Rain came after Nicole visited the Union County Fair, and then evolved as she interviewed farmers, ranchers, and community members for 6 weeks in the Summer and Fall of 2014. The UC Fair would be her first event in the community and she brought a groundwater display to share with the kids who visited our booth. They seemed to love it. We played with a rising and lowering water table, used food coloring to trace water flow, and tried to recall our previous knowledge about the water cycle. The fair kept students busy showing animals, but before long the kids were stopping by to do their own demonstrations and test experiments involving wetlands, wells, and rivers.
One important point about the groundwater display is the way it oversimplifies our understanding about the timescale and geography of water flow. This fun animation describes the big picture. For the 5-states area, some research from Kansas State explains the past, present, and future of the Ogallala Aquifer--and the impacts for folks in agriculture.
At the fair, I learned that several New Mexico Soil and Water Districts have contracted with Zielger Geological Consulting to map area water resources. You can learn more about this homegrown hydrogeology effort which includes several counties in NE New Mexico.
|
 RSS Feed