|
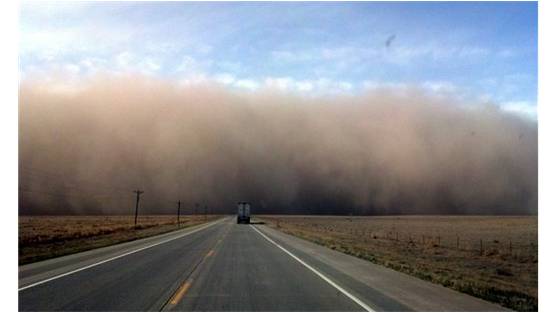
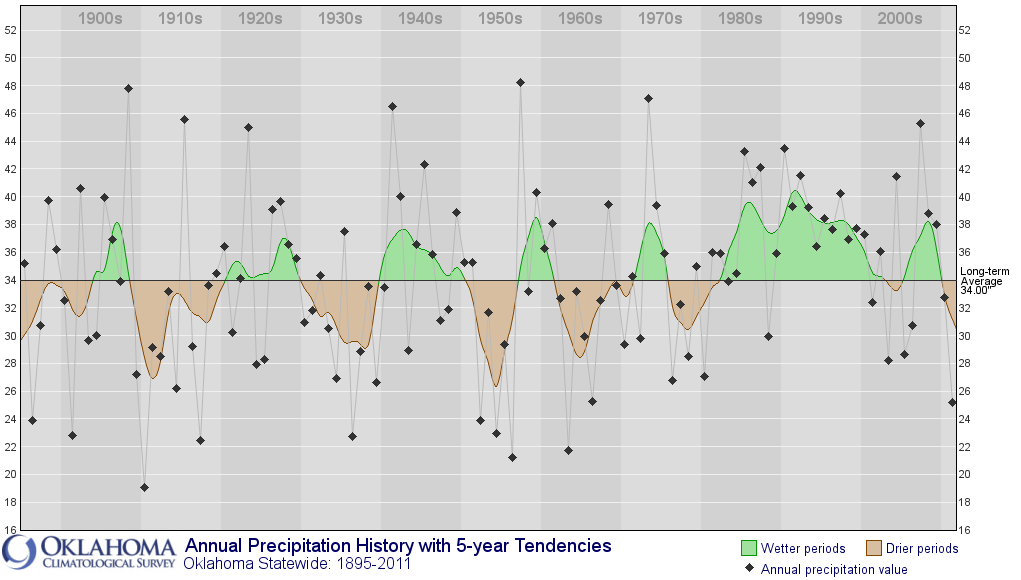
By all accounts, things are droughty out here. And have been like that for too long! But how does it compare to the Dust Bowl of the 1930's? Or the dry periods in the 1950's and 1970's? A lot of old timers say it is just as bad. At least it rained during the Dust Bowl! The land is blowing again. The thistle/tumbleweed are thick. The only consolation is the ability to learn from the Dust Bowl and to improve our farming practices. There are dry periods and wet periods. This Oklahoma Climatological Survey chart below shows the annual precipitation history with 5-year tendencies. The wet periods are green and the dry periods are brown. If you look closely, you can see the 1950's was more severe than the 1930's. While the wet and dry periods seem to alternate every ten years, there was a long lasting wet period that began in the 1980's. Although hardly a consolation, in climatological terms it seems we were overdue for a drought! Scientists were surprised by the 2012 Central Plains Drought. According to a NOAA Drought Task Force, the period of May through August 2012 was the "driest period since 1895, eclipsing the driest summer of 1934 and 1936". Apparently, this onset of this "flash" drought was hard to predict and for many farmers (expecting relief from early years) found the US Seasonal Drought Outlook warning was just too late. The impact was devastating as the Central Plains experienced the largest single year loss in corn since 1866. This animation shows the USDM from November 2011 to December 2012. How does this drought compare? Use the Drought Risk Atlas to get historical drought information and use an interactive visualization tool for assessing your risk to drought. Comments are closed.
|


 RSS Feed